
Solar Energy
Home Energy Upgrade Payback: Simple and Discounted Methods
Calculate home energy upgrade payback with a clear baseline, net annual benefit and simple...
4 min

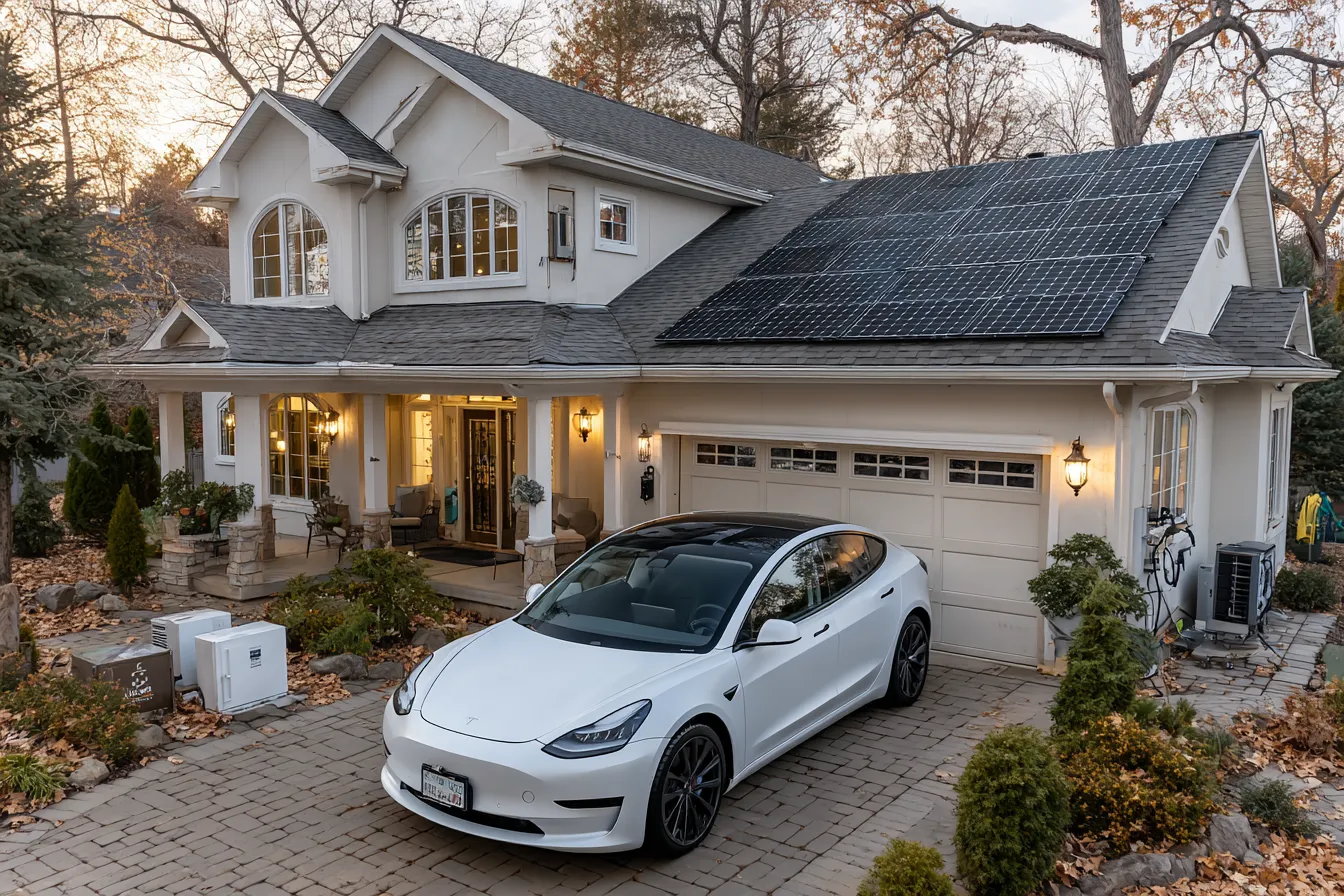
Connect solar sizing and cost using a consistent household target, module assumptions and two hypothetical proposals before evaluating bill savings.
Solar sizing and cost should be compared against the same household objective and site assumptions. Canadian homeowners need to understand why a proposal recommends its capacity, what that capacity is expected to produce and which extra work changes the price.
This comparison links those inputs using two fictional proposals. It does not select a system from annual consumption alone or provide current Canadian installation prices.
Collect representative electricity use and identify committed changes such as heating conversion or vehicle charging. Keep current measured use separate from a modelled future demand. A higher future estimate should explain the projects and assumptions behind it.
State the goal: partial generation, an annual energy target or another outcome. Aiming for annual energy balance is different from supplying the home each hour or eliminating every utility charge.
Ask how the generation model treats orientation, shading, weather, losses and the year basis of the estimate. NRCan’s PV-resource maps describe lifetime-average potential and limitations; they do not replace a proposed roof layout.
Confirm whether an input is first-year output or a longer-term average before applying further decline assumptions. Do not combine a resource-map figure and a different proposal forecast as though both represent exactly the same basis.
Assume an 8,000 kWh annual household target, 400-watt modules and an invented yield of 1,000 kWh per installed kW for this exercise. The quotes and generation estimates below are fictional.
| Input or output | Proposal A | Proposal B |
|---|---|---|
| Module count | 15 | 20 |
| DC capacity | 6 kW | 8 kW |
| Assumed annual generation | 6,000 kWh | 8,000 kWh |
| Share of the annual energy target | 75% | 100% |
| Assumed comparable installed price | $18,000 | $24,000 |
| Price per DC watt | $3 | $3 |
The ratios explain the assumptions; they do not prove the larger proposal is feasible or better. An actual layout, structural/electrical review and utility conditions can constrain both options.
In the fictional comparison, five more modules add 2 kW and an assumed 2,000 kWh annually for an extra $6,000. Ask which roof area supports that increment, how its shading differs and whether it introduces additional site work.
Equal dollars per watt do not establish equal service, warranty, roof condition or output confidence. If the larger offer includes a different inverter, battery, electrical upgrade or access requirement, separate that scope before comparing the ratio.
The roof-space guide helps frame the physical-area question. Module counts still need the exact dimensions and a feasible measured plan.
Do not multiply every generated kWh by a generic retail rate. Ask how much electricity is expected to be used directly, exported and credited or otherwise valued under the account terms. Keep remaining charges visible.
OEB’s Ontario example explains why consumption-related credits do not offset every bill charge. Other arrangements need their own current review. In the table, 100% of annual energy is therefore not a promise of 100% bill reduction.
After comparing feasible scopes, model service, replacement, production changes, prices and borrowing where relevant. The solar financial-model guide addresses that distinct task.
Keep incentives conditional and separate from the gross price. Solenery’s personalized discovery and address-based matching remain premium features in the existing property flow. Neither a capacity calculation nor a quoted payment confirms eligibility.
Ask each bidder to explain the same chain: household objective, feasible capacity, modelled generation, complete price and billing assumptions. That makes the proposal reviewable before a larger number or a lower unit price becomes the deciding factor.
Calculate home energy upgrade payback with a clear baseline, net annual benefit and simple...

Assess Ottawa winter solar production with a monthly evidence sheet covering snow assumptions,...

Check net-zero building code claims against the locally applicable code, defined performance...